
 |
Landfill GHG Emissions Showing Improvement
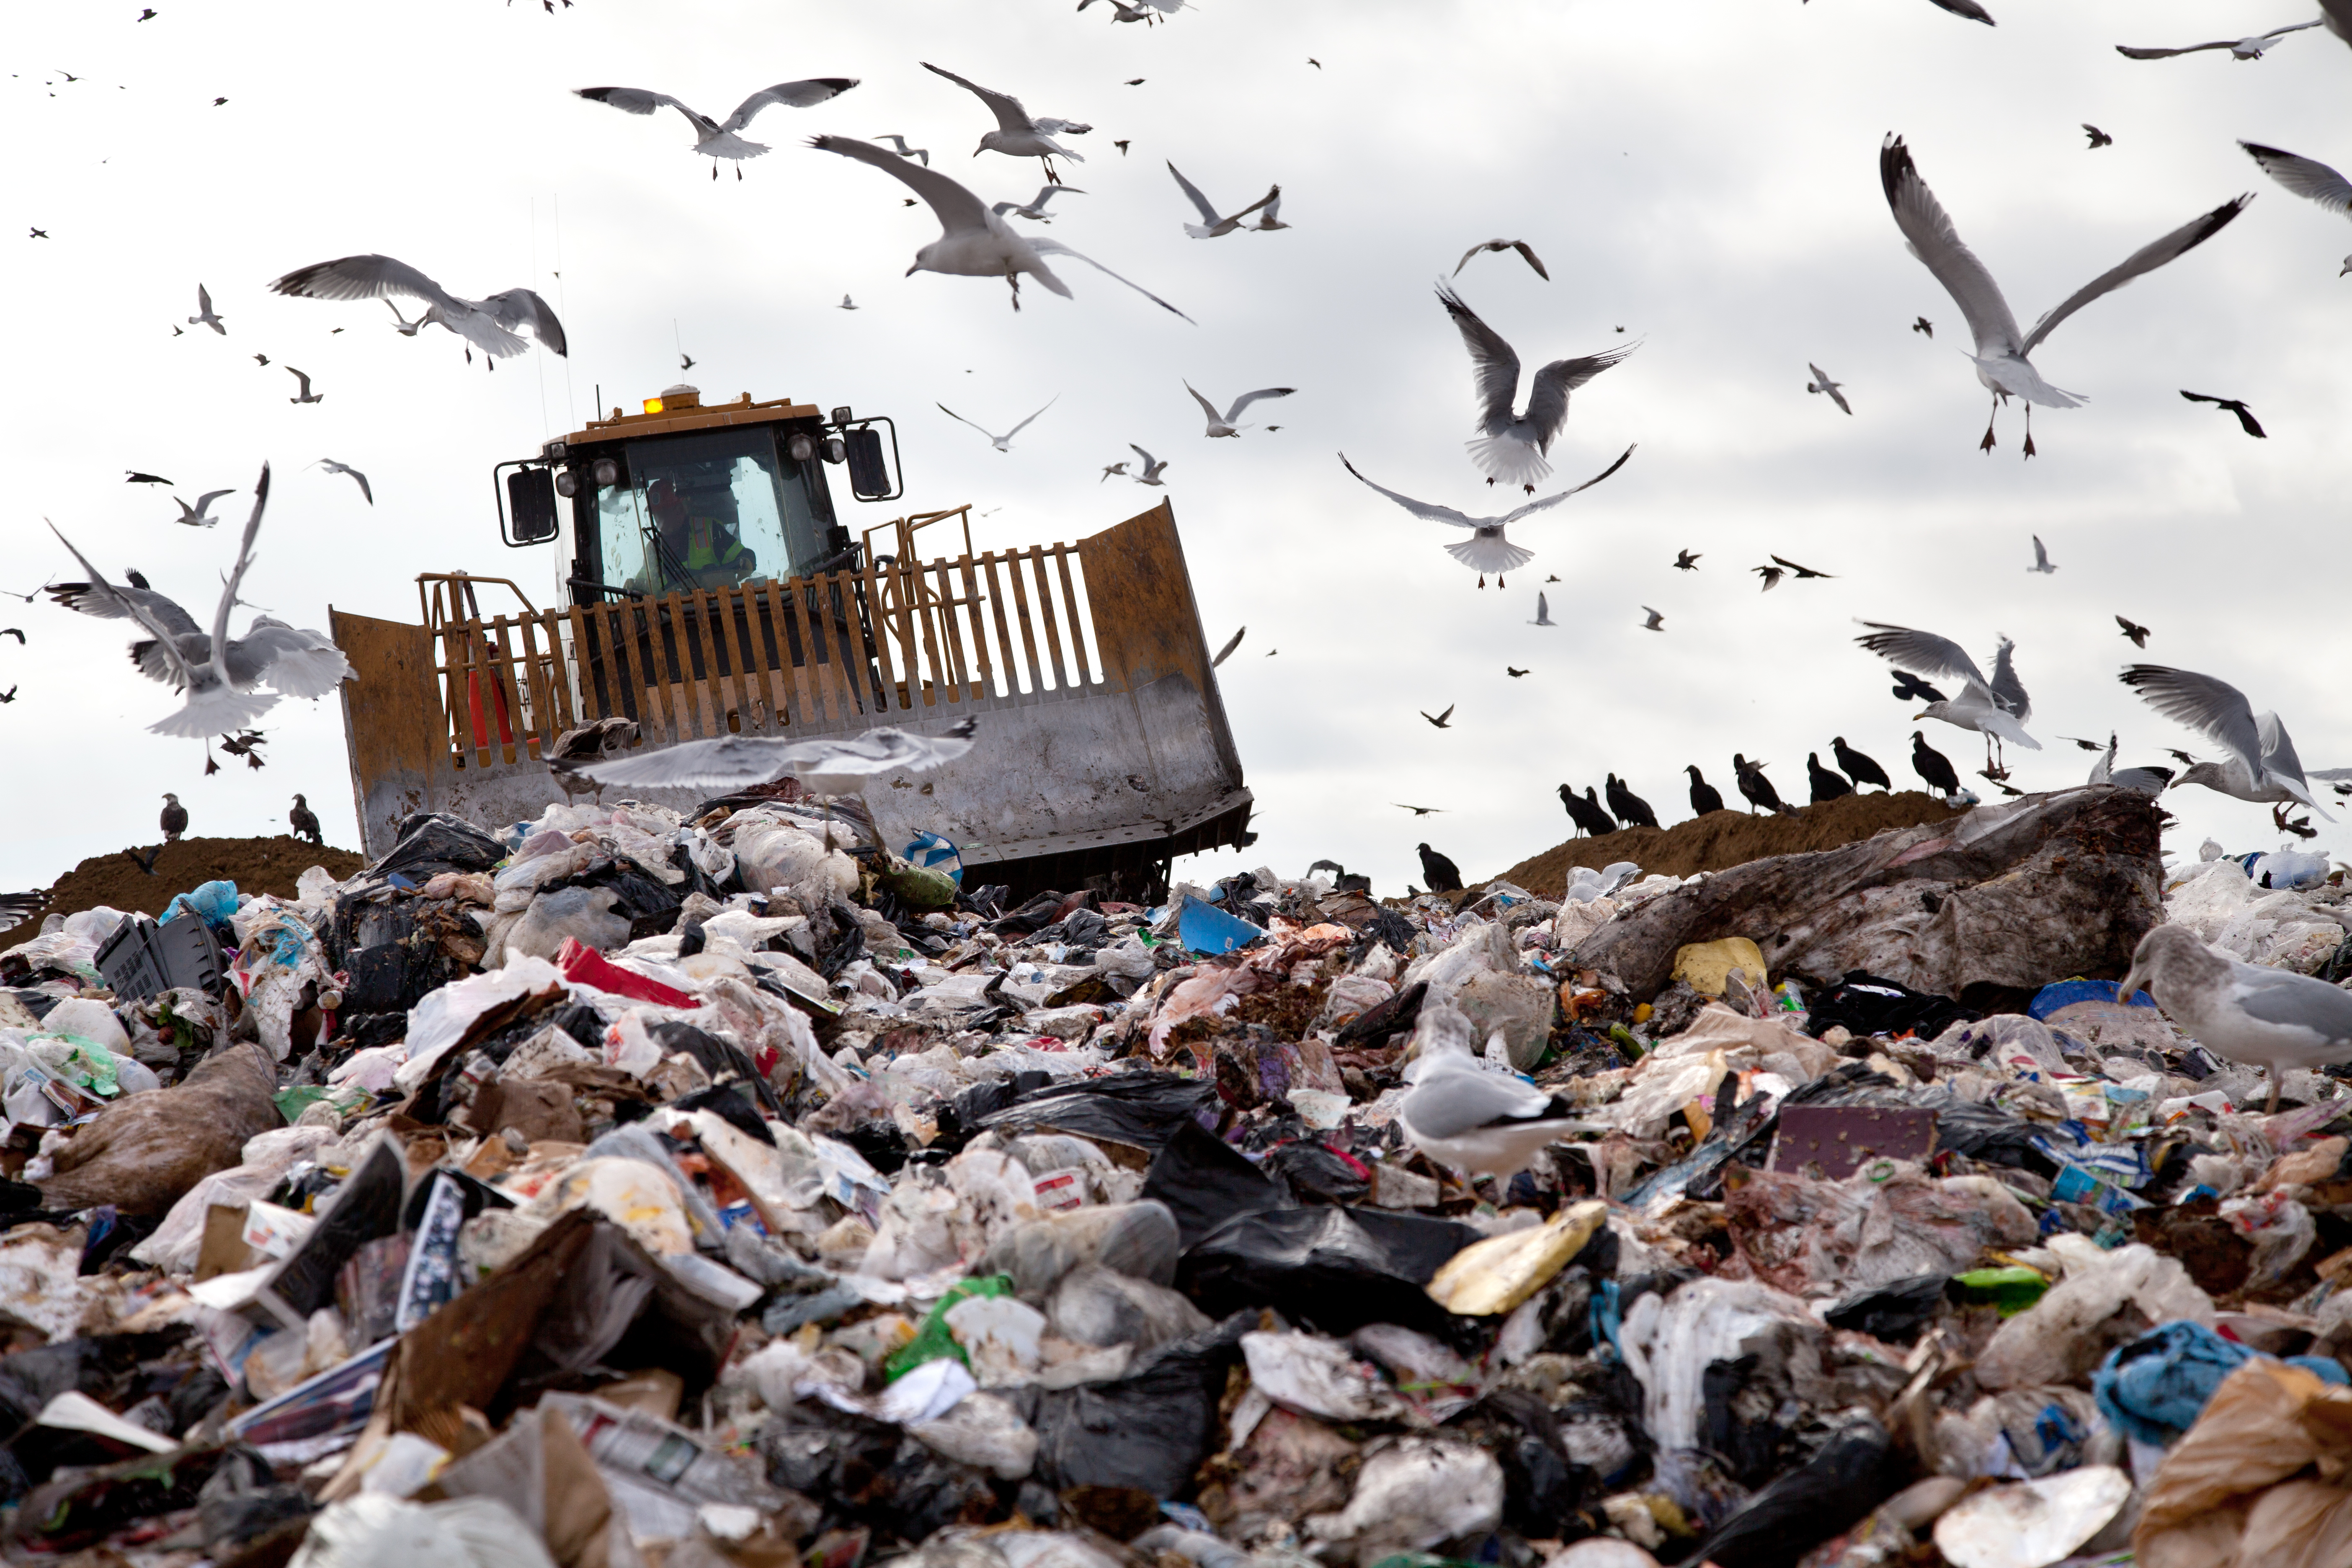
Since our beginning, people have thrown things away, leaving a trail of waste debris behind us for millennia. As populations have grown however, our local “dumps” have become MSW landfills – massive, manmade mountains of decomposing trash where nature take its course over weeks, months and years, all the while emitting GHGs as byproducts.
Of the two gases, CH4 has the dubious distinction of being in second place quantity wise, but in first place for its ability to trap radiation. According to the EPA, “Pound for pound, the comparative impact of CH4 on climate change is over 20 times greater than CO2 over a 100-year period.” Although CH4 does occur in nature (wetlands being the largest natural source), more than 60 percent of total CH4 emissions worldwide comes from human activities. In the United States, landfills are the third largest source of CH4.
In its recently released report titled, DRAFT Inventory of U.S. Greenhouse Gas Emissions and Sinks 1990-2012, the EPA takes a close look at the realities of GHG emissions over 22 years, including how MSW management is evolving and improving, even as landfills remain the nation’s most commonly used waste management technique.
Forget expensive calls to lawyers and consultants. With Enviro.BLR.com2014 EHS Salary GuideDownload Now.
Although each landfill is unique, the report defines several factors that influence emissions, in particular, CH4:
1) the total amount of waste-in-place, which is the total waste landfilled annually over the operational lifetime of a landfill,
2) the characteristics of the landfill receiving waste (i.e., composition of waste-in-place, size, climate, cover material),
3) the amount of CH4 that is recovered and either flared or used for energy purposes, and
4) the amount of CH4 oxidized as the landfill gas passes through the cover material into the atmosphere.
It is also notable that although the number of MWS landfills operating in the United States has dropped from about 6,326 in 1990 to about 2,000 in 2010, the average size of landfills has increased. So has the amount of waste landfilled, which is up 26 percent from 205 teragrams (Tg) in 1990 to 284 Tg in 2012, something EPA says varies annually and is expected to increase as the population grows, unless recycling and composting increase as well.
Everything You Need for Environmental Compliance
Enviro.BLR.com puts everything you need at your fingertips, including practical RCRA, CAA, CWA, hazardous waste regulatory analysis and activity, news, and compliance tools. Try it at no cost or risk and get a FREE report.
As the third largest source of CH4, MSW landfills accounted for about 18.2 percent of total U.S. anthropogenic* CH4 emissions in 2012. However, MSW landfills have seen a fairly consistent decrease in all waste-related emissions beginning in 1990 at 161.2 Tg CO2 Eq. (or million metric tons, CO2 Equivalent) and dropping to 117.2 Tg in 2012. From 1990 to 2012, net CH4 emissions decreased about 30 percent, which the EPA attributes to a 21-percent reduction in decomposable materials such as paper/paperboard, food waste and yard waste, coupled with the increased collection of landfill gas for energy or combustion (flaring) that became a regulatory requirement for large MSW landfills in 1996.
This collection/combustion of CH4 has increased from about 954 gigagrams (Gg) in 1990 to approximately 8,648 Gg in 2012, representing an 11-percent annual increase in quantity of CH4 managed during that time span. The EPA also reports that in 2012 alone, an estimated 67 new landfill gas-to-energy (LFGTE) projects and three new flares began operations, although the rate of increase in collection/combustion no longer exceeds the growth rate of additional CH4 blamed on population increase. In March, the Obama Administration also announced a strategy to reduce CH4 emissions from major sources, including landfills, and the EPA is expected to propose updated standards this summer.
*The term “anthropogenic” in this context, refers to greenhouse gas emissions and removals that are a direct result of human activities or are the result of natural processes that have been affected by human activities.