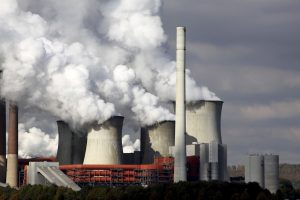
EPA’s just-released 2016 Toxics Release Inventory (TRI) National Analysis paints an ambiguous picture of the electric utility sector. The good news is that all releases from the sector are down compared to numbers in the 2015 analysis. But what is also down is the number of facilities reporting. In the 2015 analysis, 554 facilities sent in TRI data; in 2016, the number fell to 494, nearly an 11 percent drop in reporting facilities. These numbers cover only those establishments that generated, transmitted, and distributed electric power from the combustion of coal or oil; electric power plants that combust natural gas are not required to report under TRI. In other words, the improved environmental performance of the sector is, to a large extent, the result of the industry’s transition to natural gas and the retirement of coal- and oil-fired power plants.
10 Years of Improvement
When the TRI data are viewed over a longer time frame, the electric utility sector has achieved substantial reductions in multiple TRI data fields. For example, from 2006 to 2016, the amount of managed production-related waste decreased by 463 million pounds (lb) (24 percent). Again, this is at least partly attributed to the decline in coal and oil combustion; over the 10-year period, net electricity generated using coal and oil fell by 38 percent. At the same time, the industry dramatically improved the management of releases. For the 2006–2016 period, releases per gigawatt hour dropped a remarkable 42 percent.
Air and Land Releases
Here are additional data about the sector included in the 2016 analysis:
- Approximately three-quarters of the total production-related waste were treated, while one-quarter was released to the environment. This is in contrast to 2006, when over half of the waste was released. This trend is largely due to an increase in scrubbers at electric utilities that treat (or destroy) TRI reportable acid gases that would otherwise be released on-site to the air.
- Since 2006, all reportable releases decreased by 64 percent. This decrease was driven by an 87 percent decrease in on-site air releases. On-site land disposal and off-site disposal also decreased, but to a lesser extent.
- From 2015 to 2016, all reportable releases decreased by 16 percent (73 million pounds). Again, most of this reduction was in on-site air releases.
- Since 2006, reported mercury releases dropped by 46 percent (68 thousand lb). The considerable decrease in mercury releases was driven by an 86 percent (79 thousand lb) decrease in mercury air emissions. This drop was offset somewhat by increased releases of mercury to land. While decreased use of coal to generate electricity does play a role, mercury releases per gigawatt hour of electricity generated dropped even more dramatically.
- In 2016, over three times as much mercury (in coal ash) was disposed of on land compared to mercury released to air. In 2006, the amount of mercury disposed of on land was less than half that released to air. This shift in the release trend reflects higher rates of mercury capture and disposal due to improved air emissions controls, such as activated carbon injection systems installed at electric utilities.
- In September 2017, the U.S. Energy Information Administration (EIA) reported on reductions in mercury releases from coal-fired power plants as a result of EPA’s 2011 Mercury Air Toxics Standards. (EIA’s report is here.)
- Twenty-two facilities (4 percent) initiated source reduction activities in 2016 to reduce their use of TRI chemicals and generation of wastes that contain TRI chemicals. Source reduction includes activities that eliminate or reduce the generation of chemical waste in the first place. Other waste management practices, such as recycling, refer to how chemical waste is managed after it is generated. The most commonly reported types of source reduction activities for this sector were good operating practices and process modifications, which include activities such as modifying equipment, layout, or piping.
The 2016 TRI analysis is here.

