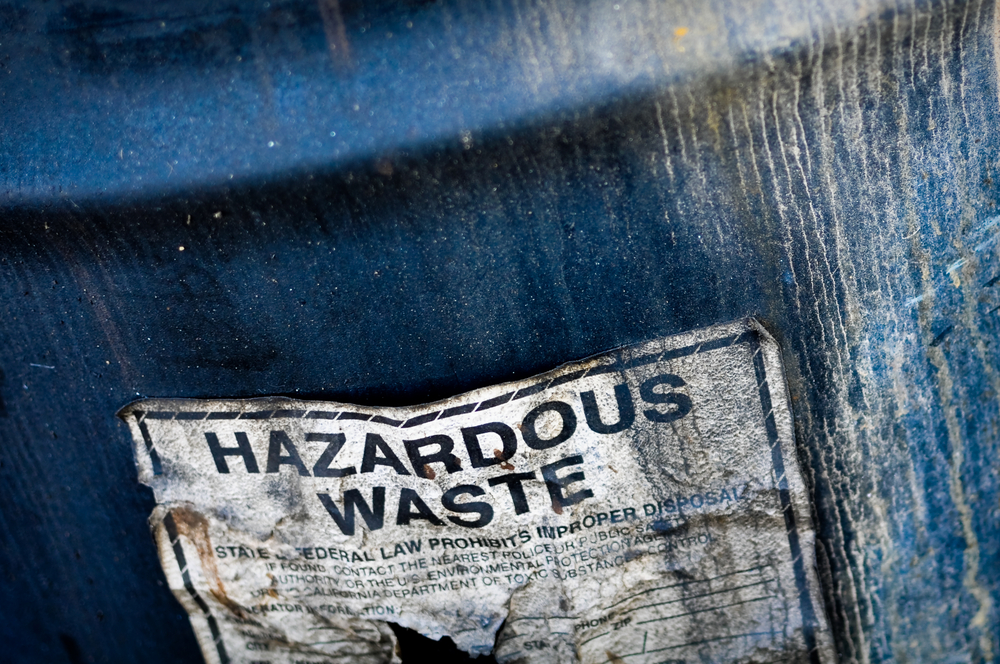
On March 3, 2022, the EPA released its 2020 Toxics Release Inventory (TRI) National Analysis. The data revealed a 10% decline in environmental releases of TRI chemicals by facilities covered by the program between 2019 and 2020.
“The 2020 TRI National Analysis summarizes TRI chemical waste management activities, including releases, that occurred during calendar year 2020,” states an EPA news release.
The analysis contains information from more than 21,000 facilities’ annual data on more than 800 chemicals they released into the environment or otherwise managed as waste. Reporting industry sectors include manufacturing, mining, electric utilities, and commercial hazardous waste management.
“EPA is encouraged by the continued decrease in releases of toxic chemicals reported to the Toxics Release Inventory,” says Michal Freedhoff, assistant administrator for the Office of Chemical Safety and Pollution Prevention. “Making this information publicly available also incentivizes companies to reduce pollution and gives communities tools to act locally – particularly underserved communities that have historically been disproportionately impacted by pollution.”
The 2020 National Analysis also contains the first reporting on 172 per- and polyfluoroalkyl substances (PFAS) added to TRI in 2020.
The data indicated that facilities managed 800,000 pounds (lb) of these chemicals in 2020, but only approximately 9,000 lb were reported as releases in that year. The majority of PFAS releases were reported by the chemical manufacturing sector, and the majority of the production-related PFAS waste was reported by hazardous waste management facilities or chemical manufacturers.
Notable trends
“Facilities that report to TRI avoided releasing into the environment more than 89 percent of the chemical-containing waste they created and managed during 2020 by using preferred practices such as recycling, energy recovery, and treatment,” the EPA says. “Facilities reported initiating nearly 3,000 new source reduction activities. EPA encourages facilities to learn from their counterparts’ best practices by using EPA’s Pollution Prevention Search Tool and adopt additional methods for reducing pollution. The report also includes a discussion of chemical releases into the environment, including air releases, which decreased by 52 million pounds from 2019 to 2020, continuing a long-term trend, as well as summaries of regional chemical waste management activities, illustrating the geographic diversity of U.S. industrial operations.”
New tools
Demographic information has been added to the EPA’s “Where You Live” mapping tool, allowing maps of facility locations to be overlayed on maps of overburdened and vulnerable communities.
The National Analysis includes a new map detailing international transfers of chemical waste by facilities in each state, as well as information about each facility that shipped the waste, the destination country, and how the waste was managed in that country.
“Additionally, the National Analysis includes a new profile of the cement manufacturing sector and the addition of greenhouse gas reporting information in certain sector profiles,” the EPA adds. “Users will be able to track greenhouse gas emissions for electric utilities, chemical manufacturing, cement manufacturing, and other sectors. This section will also include information on the benefits of source reduction in these industries.”

