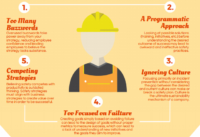
Both OSHA observations and independent research confirm that developing a strong safety culture has the potential to have the greatest impact on incident reduction of any process. Check out the infographic to find out what we learned about the state of safety culture from a recent BLR survey of over 500 EHS professionals, HR professionals, […]
Are you building a safety culture at your facility? If so, avoiding these five mistakes can save you time and resources, and make your program more successful.
Did you know April is Distracted Driving Awareness Month? Safety.BLR.com, our partner site, created an infographic highlighting 5 simple steps to help you become a safer, more focused, driver.
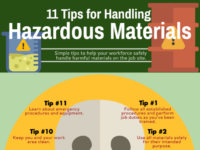
Keep your workers safe. Here are 11 tips for handling hazardous materials. Don’t become a target for one of these avoidable citations! Join us on March 29 for an in-depth webinar presented by Meaghan Boyd, a seasoned environmental litigation partner at Alston & Bird, as she discusses best practices for hazardous materials transportation. You’ll learn: […]
According to OSHA, lost productivity from workplace injuries and illnesses costs U.S. businesses $60 billion a year!
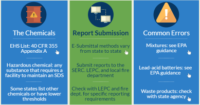
The Tier II reporting deadline is approaching. This infographic provides essential information to help you determine if you need to report, along with some helpful tips for preparing and submitting a Tier II report.
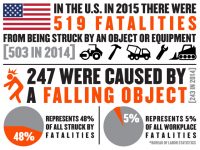
By Nate Bohmbach, Associate Product Director, Ergodyne 247 people lost their lives due to a dropped object in 2015, but new standards are currently in the works to help guide efforts focused on preventing these tragic accidents.
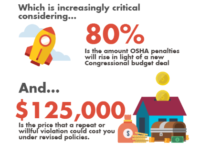
From 2015 to 2017, OSHA fines increased almost 80%, making the cost of noncompliance too expensive for most organizations to ignore. This new infographic aims to help safety pros, like you, strengthen compliance, reduce costs, and improve operational efficiency. Understanding the Safety Puzzle The infographic reviews issues safety pros may face this year. Topics covered include: the […]
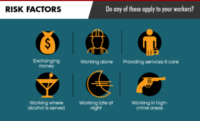
With workplace violence attacks becoming more prevalent in the US, organizations need to be prepared for worst-case scenarios. Attacks in the workplace average three deaths and up to 12 injuries per attack, and lawsuits average $500,000 with jury awards averaging $3 million. Worse yet, the loss of friends and colleagues in the workplace is devastating…and […]
Do you know what new requirements have been finalized under the Hazardous Waste Generator Improvements Rule? This infographic provides a view into what will be in store soon for all classes of hazardous waste generators.

